Calling All Indy Vendors!
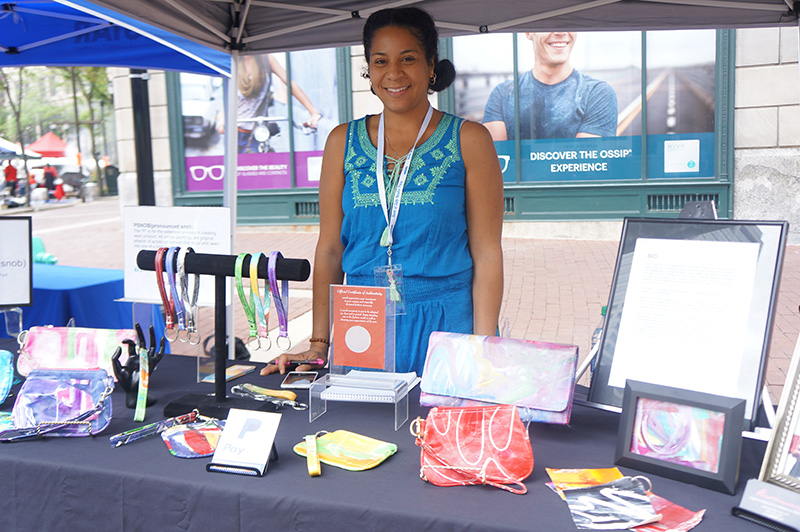
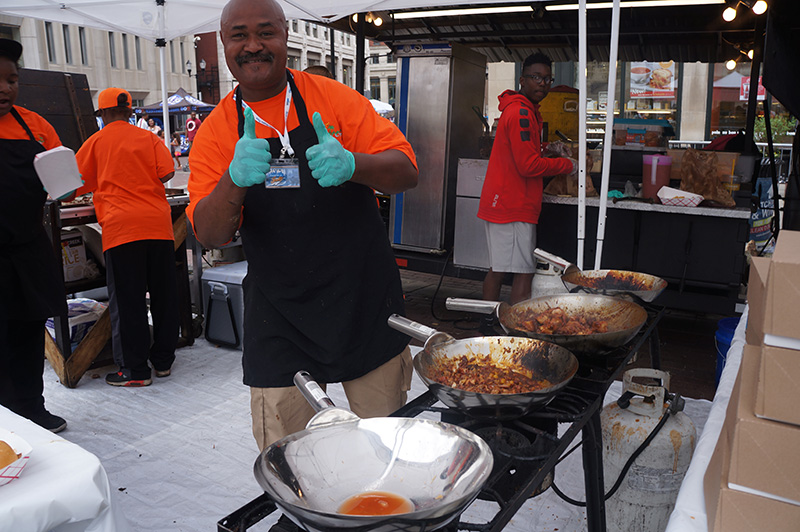
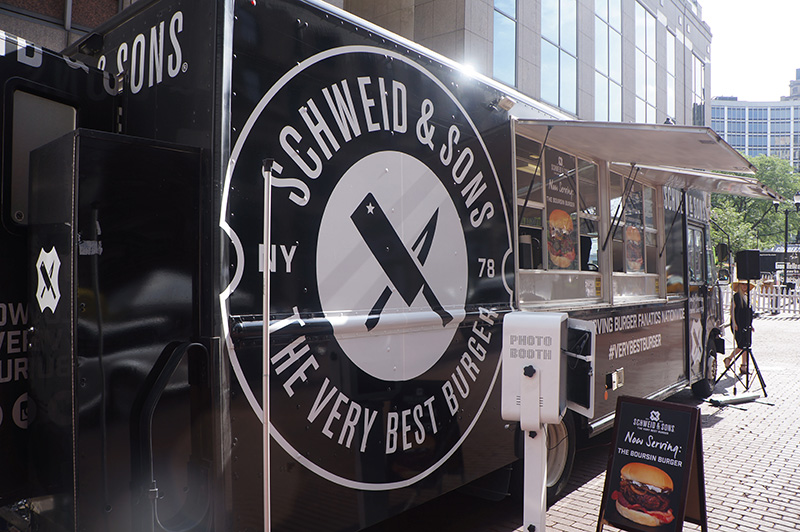
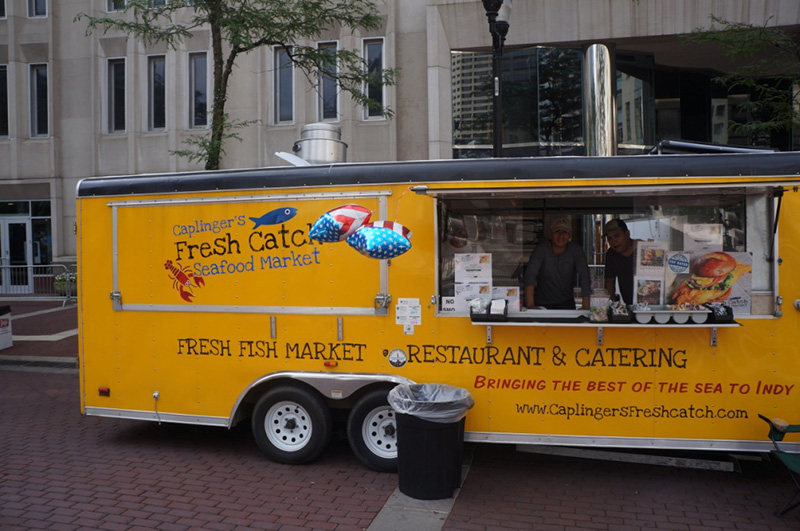
Do you want to get your food or wares in front of a crowd of thousands? Whether you’re a restaurant or bar, a local retail business, an artist, or a non-profit, we’d love to have you with us. Fill out the interest form below and join us for the largest food festival in Indiana!
LAST DAY to Register as a Vendor May 31, 2025
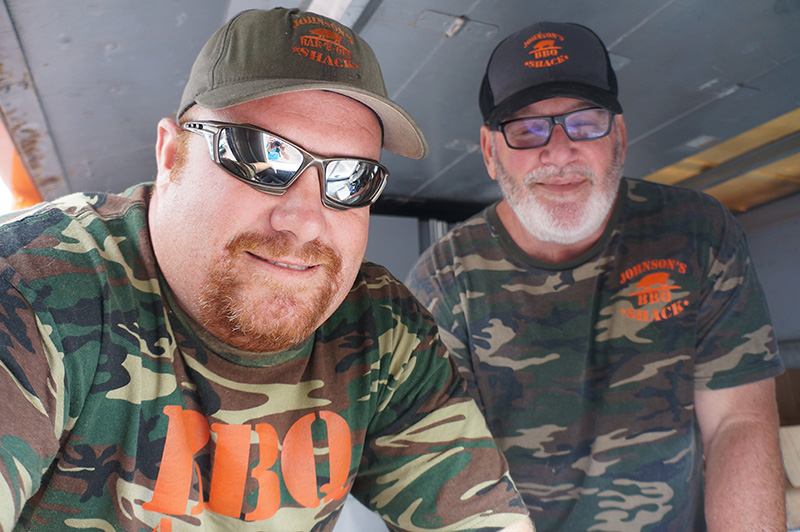
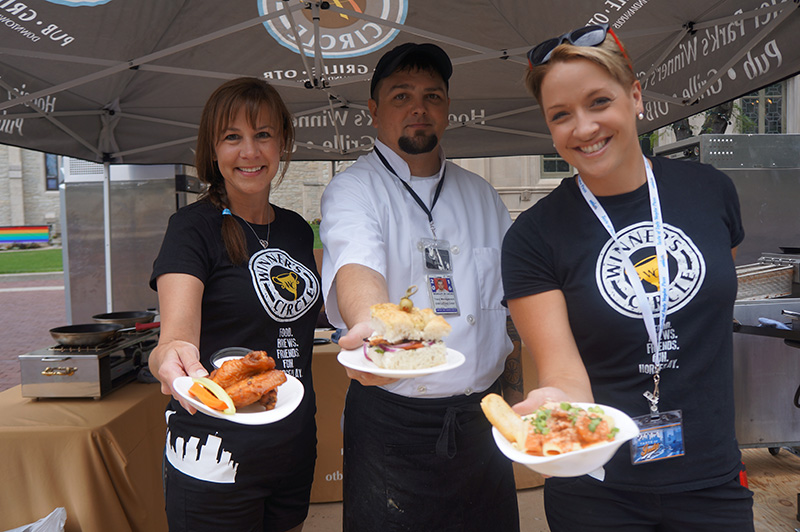
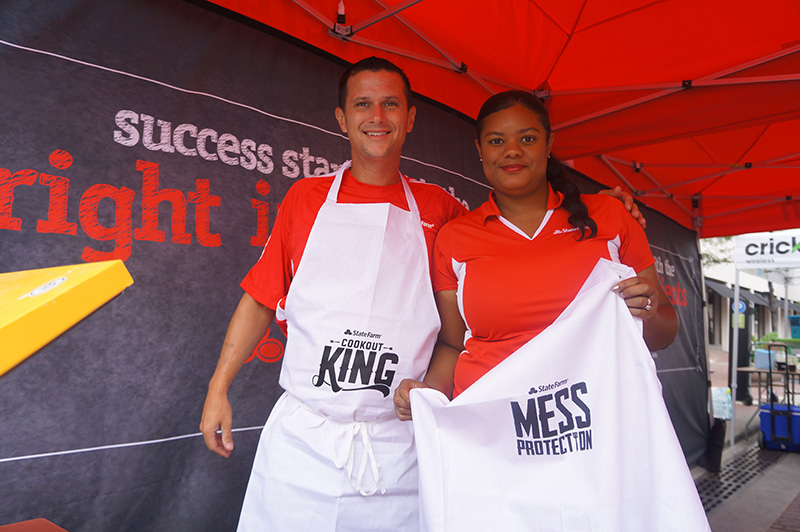
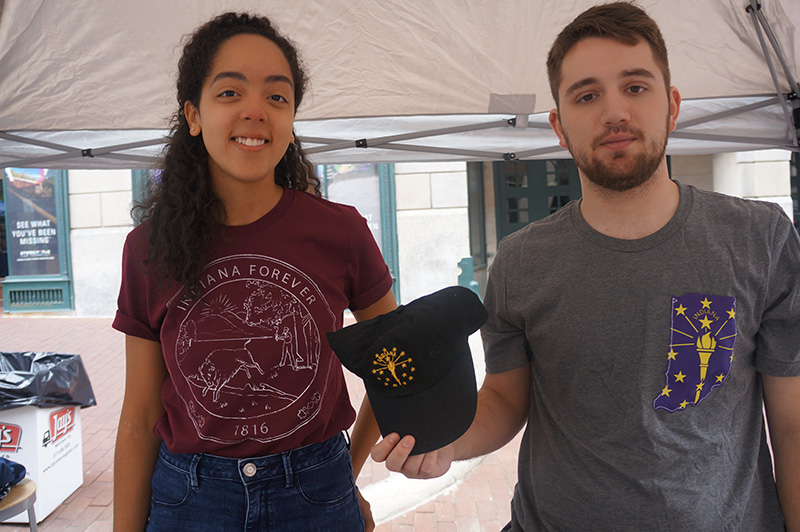
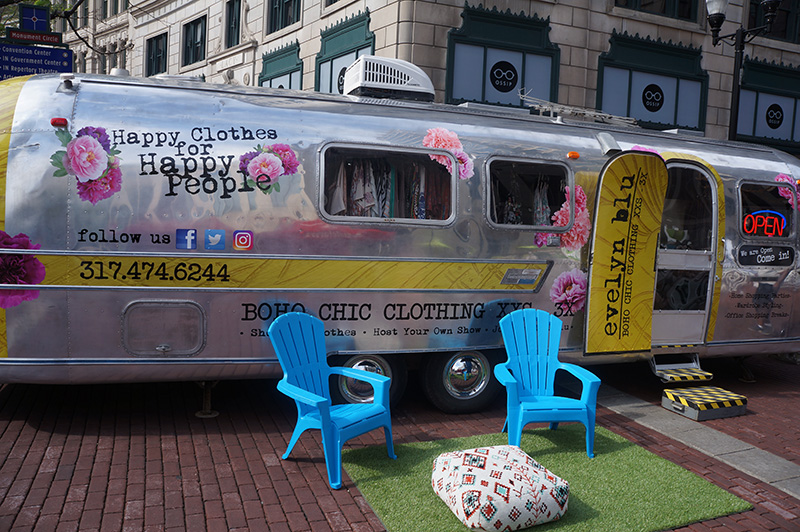
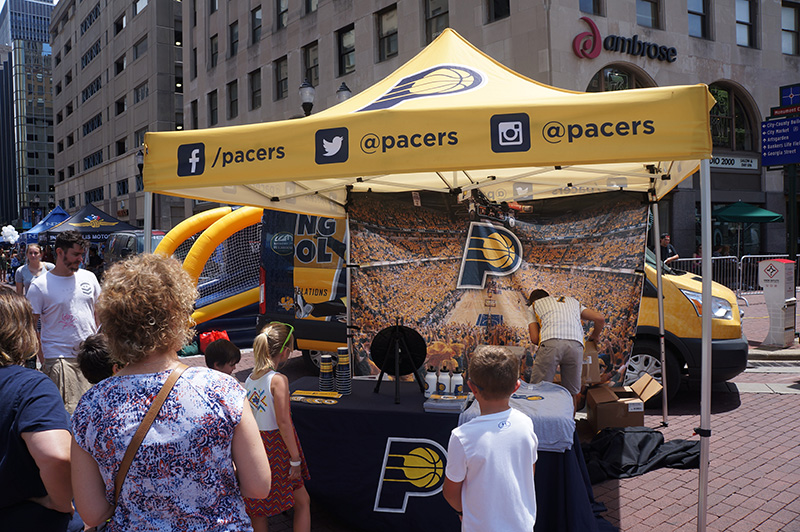
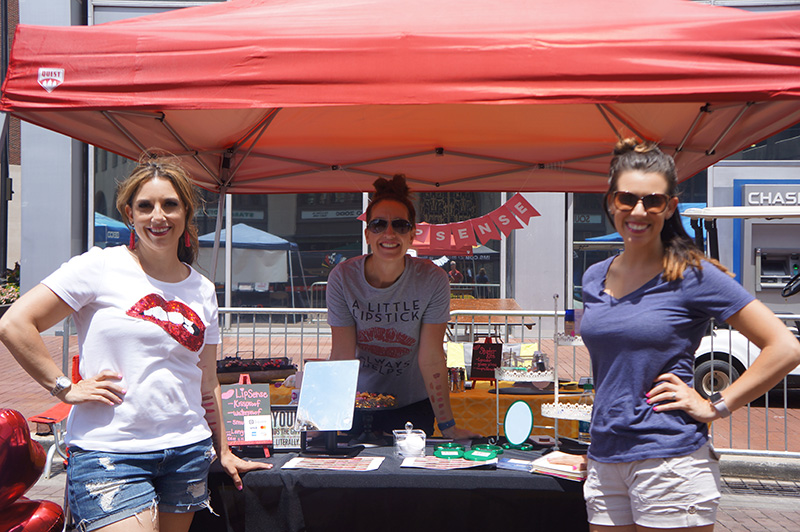
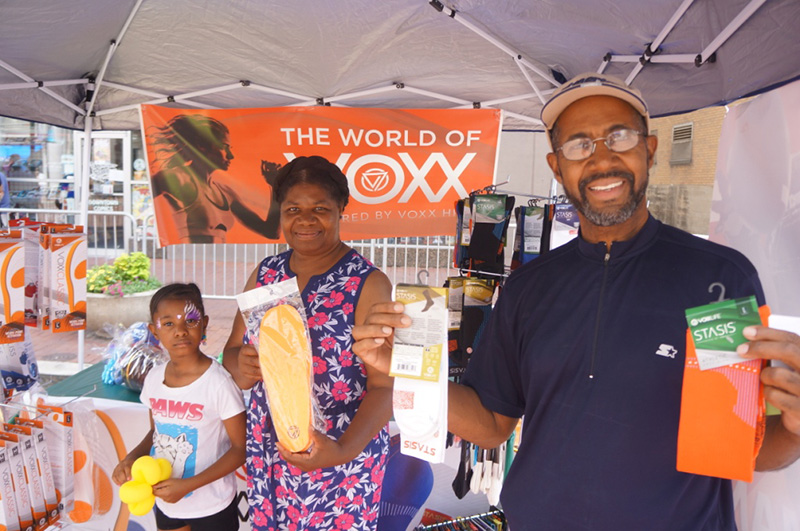
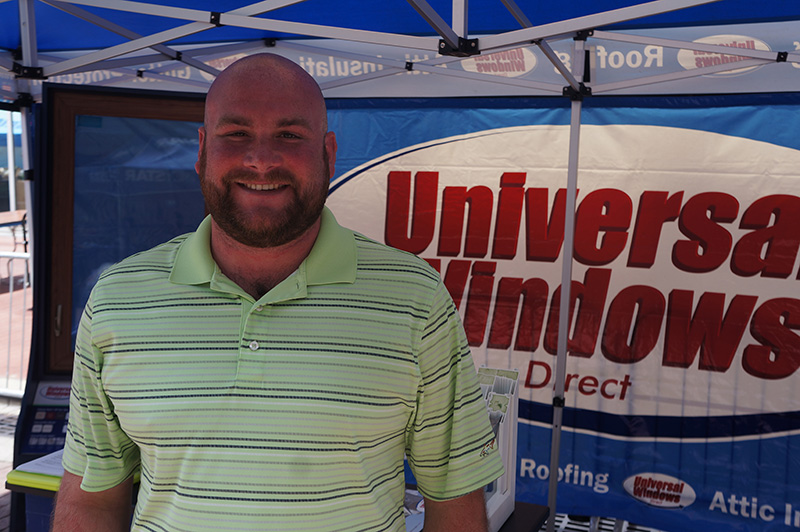
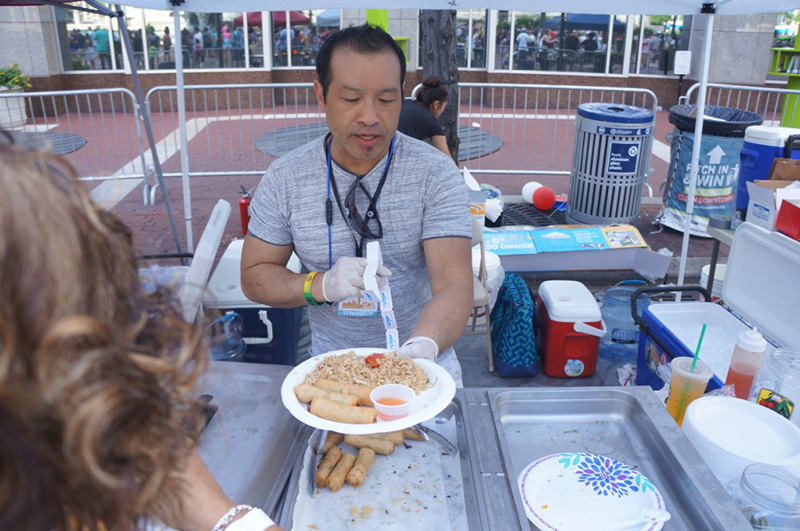
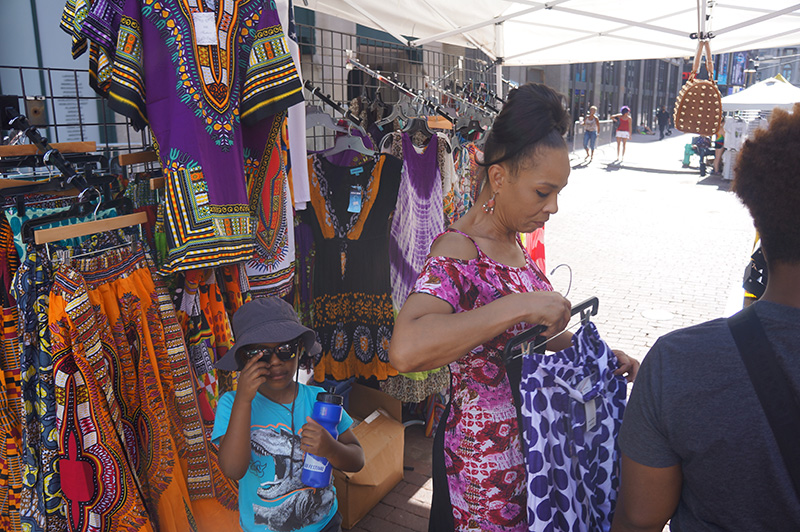
Vendors Gallery